Disclaimer: When these guidelines were being drawn up, the correct translations of titles, parameters and texts in the healthstat.be application were not yet available for the Hand Hygiene project. Consequently, there may be a difference between the instruction and the accompanying images of the healthstat.be application. The changes will be made as soon as the translations are available.
The first report of the Hand Hygiene project in healthstat.be is the ‘Observance’ report. Below we will explain the different steps to create an Observance report.
Tip: The language of the menu and the selection screens are based on the language choice you made at the top of the screen. You can change it at any time.
A. Create ‘Observance’ report
Step 1: Select period
- Not all selections are visible at the start of the report due to the fact that input can change depending on the previous choice.
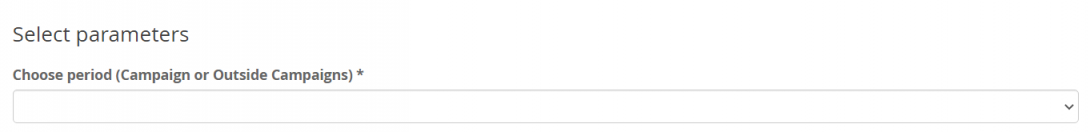
- If a choice is indicated with an asterix (*) the choice is mandatory.
- Based on this choice, the parameter screen will change.
- Therefore we will describe all 3 scenarios.
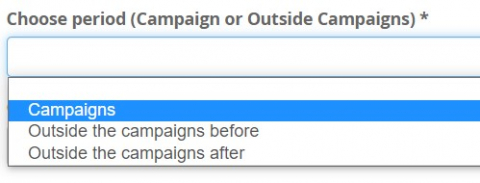
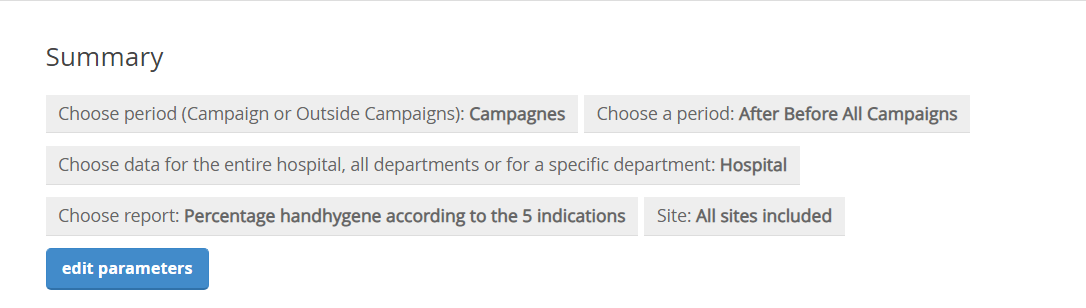
Option 1: "Campaigns"
- For the choice “Campaigns”
You will have to choose a specific period:
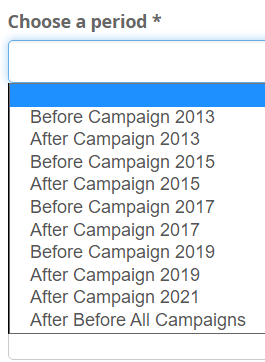
We select here ‘After Before all Campaigns’
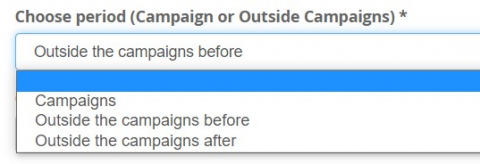
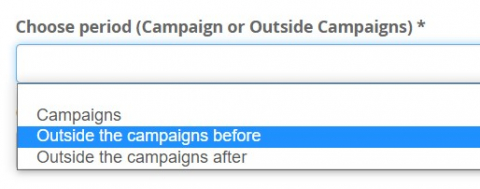
Option 2: "Outside Campaigns Before"
- When making the selection “Outside Campaigns Before”
two new selection fields will appear:
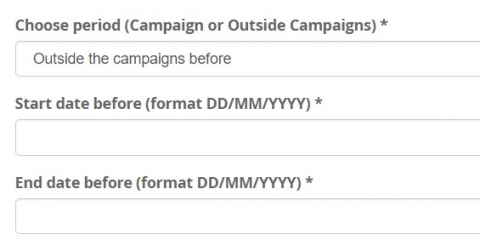
- Here we give a start date and an end date in the correct format! The format is specified as DD/MM/YYYY (Example: 02/07/2021). It is important you use the correct format, otherwise the reports will not generate any results!
Option 3: "Outside Campaigns After"
- When making the selection “Outside Campaigns After”
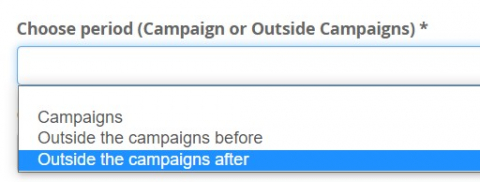
four new selection fields will appear:
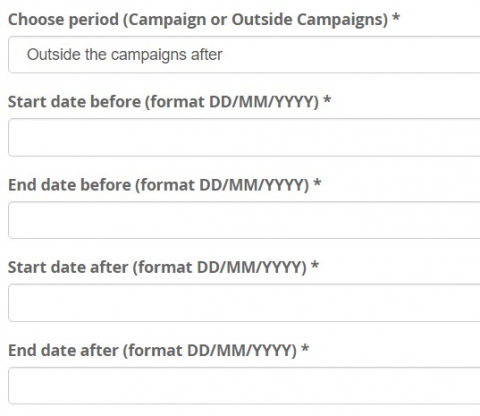
- Here we give a start date and an end date in the correct format. We have to give 2 dates for the campaign before and 2 dates for the campaign after.
- The format is specified as DD/MM/YYYY (Example: 02/07/2021). It is important you use the correct format, otherwise the reports will not generate any results!
Step 2: Select data
- In the second step, a selection between Hospital, Multiple departments and Single department has to be made:
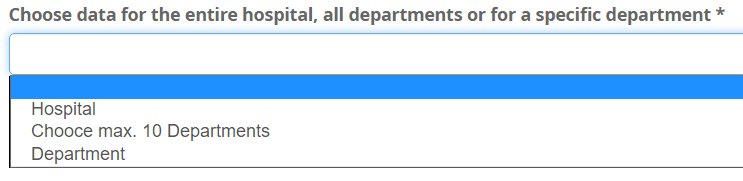
Hospital: This means that the data for the entire Hospital will be summarized and shown on the graph/table. Entire hospital = Every ward from every site with the same NIHDI Number! If you want to only see the data of you site, you can change this with the parameter “Site” further on.
Choose max. 10 departments: You get to use max. 10 departments from a list. For all departments, a separate graph and table will be created, if we have data for the selection made.
Departement: Specify one department
Option 1: Hospital
- After this choice there is no extra parameter defined to select.
- You will get to choose the report you want to see.
- This is the same for all choices you make in the previous step.
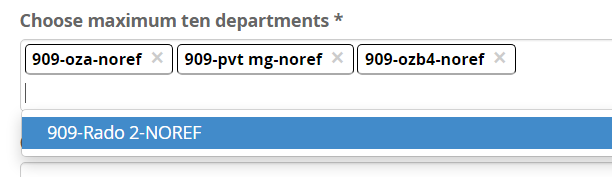
Option 2: Choose max. 10 Departments
- When selecting this choice, you will get a list of all possible departments
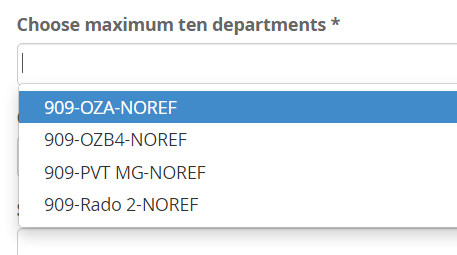
and you can select up to 10 possibilities:
Option 3: Department
- When you select this choice, you will receive the same list as in the previous selection
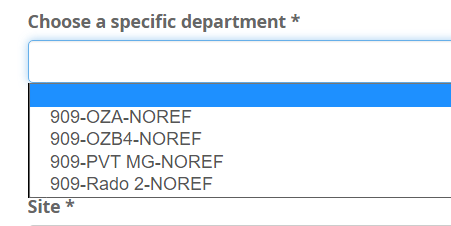
but with the difference that you can only chose 1 department.
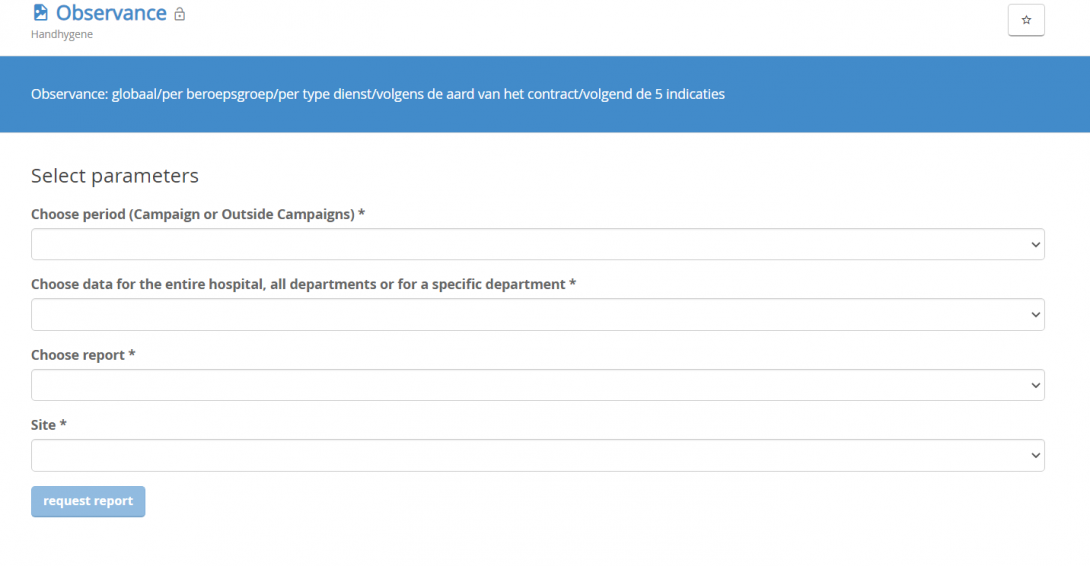
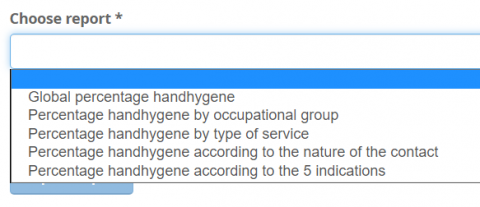
Step 3: Select report
- When the population has been chosen and the period it refers to, we can select a report.
Step 4: Select site
- Also this choice is mandatory and contains info based on the hospital you are linked to.
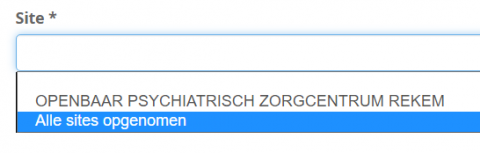
- If there are specific sites, you can select them or you can choose to include all sites. If you choose to include all sites, you will see an overview for all sites that are linked to the same NIHDI number! If you only want to see the numbers for your own hospital/site, please select the correct site from the list.
- All selections have been made and you can execute the report by clicking on :

B. Results
- Based on the selected report the outcome can be different.
Report 1: Global percentage hand hygiene
View 1: Summary of selected parameters
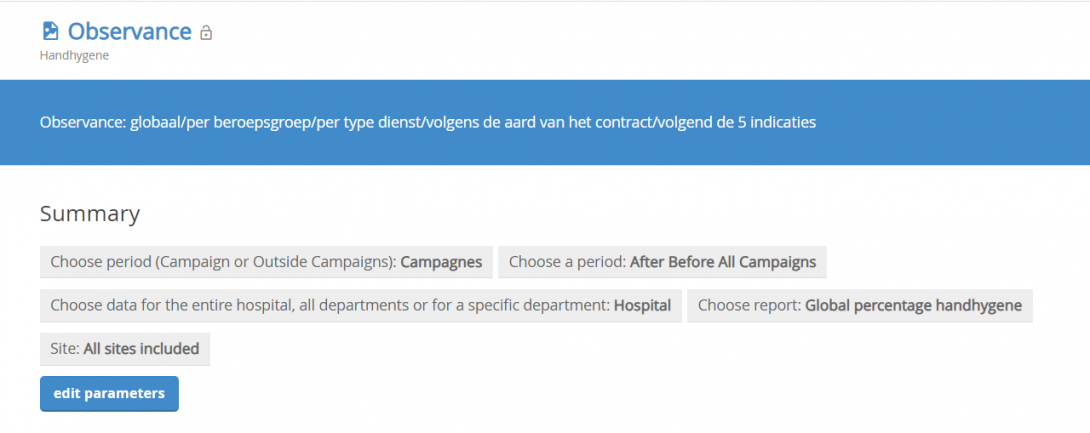
You can change the parameters at all times.
View 2: Graph view of report
View 3: Table view of report
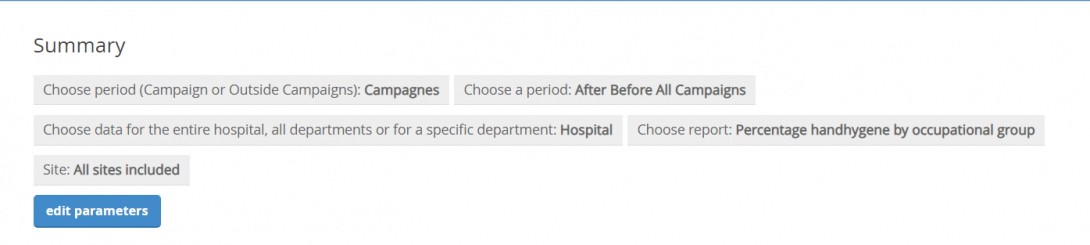
Report 2: Percentage hand hygiene by occupational group
View 1: Summary of selected parameters
View 2: Graph view of report
View 3: Table view of report

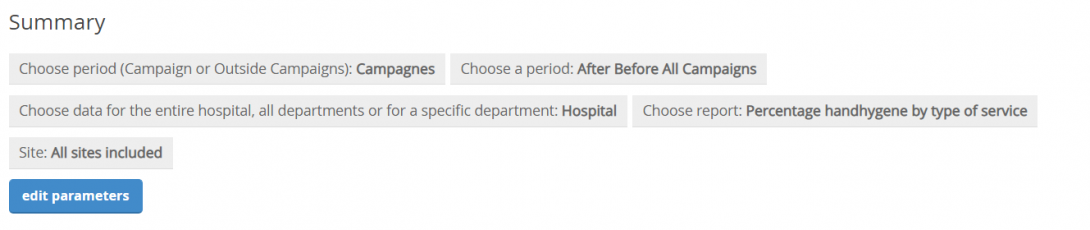
Report 3: Percentage hand hygiene by type of service
View 1: Summary of selected parameters
View 2: Graph view of report
View 3: Table view of report
Report 4: Percentage hand hygiene according to the nature of the contact
View 1: Summary of selected parameters

View 2: Graph view of report
View 3: Table view of report
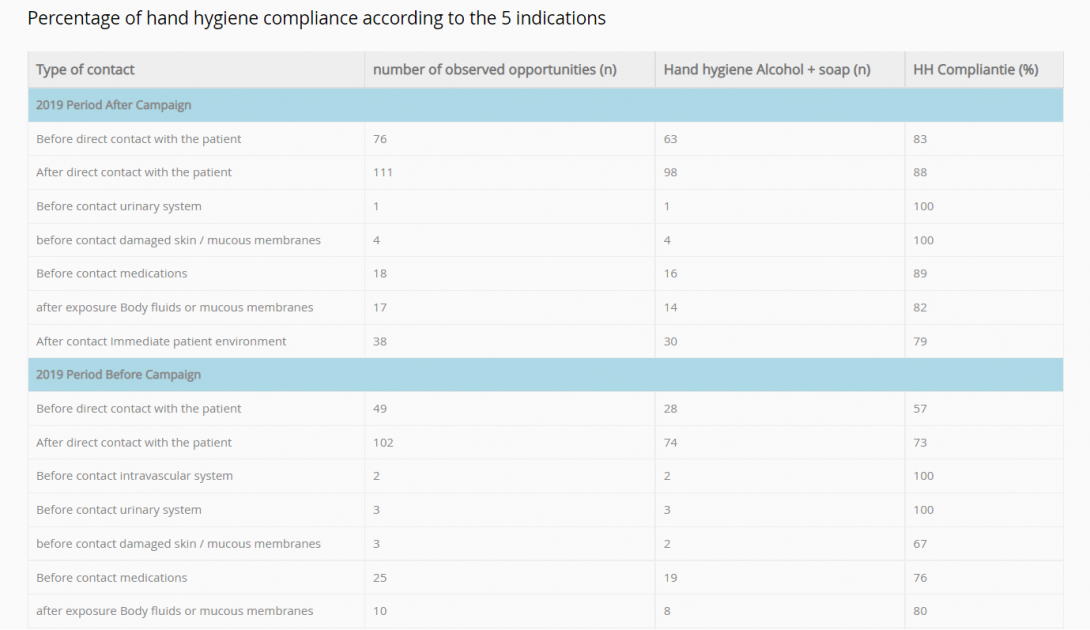
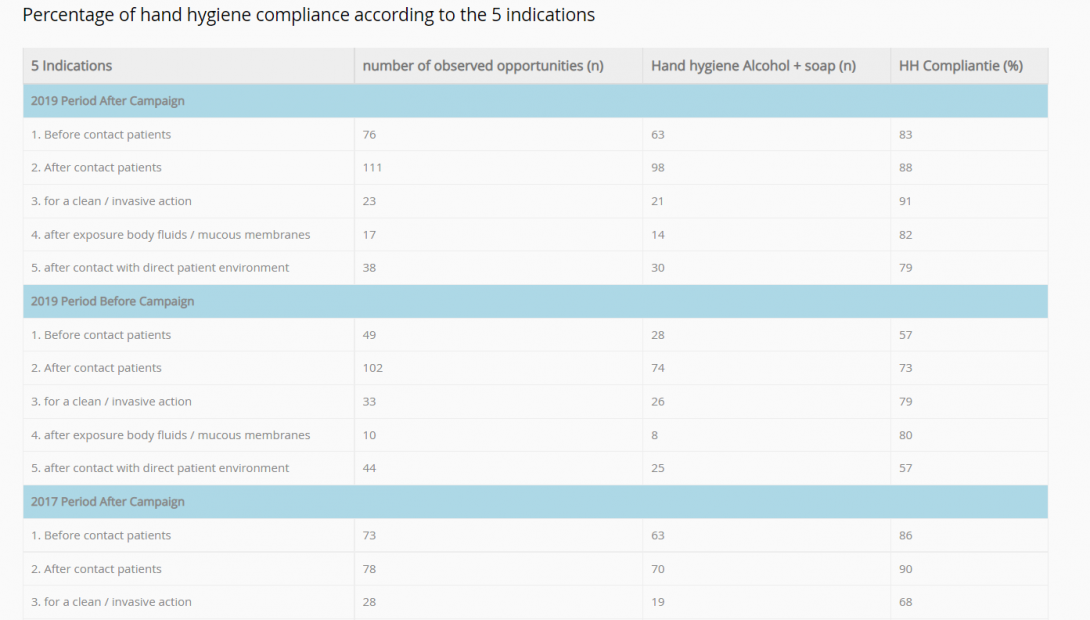
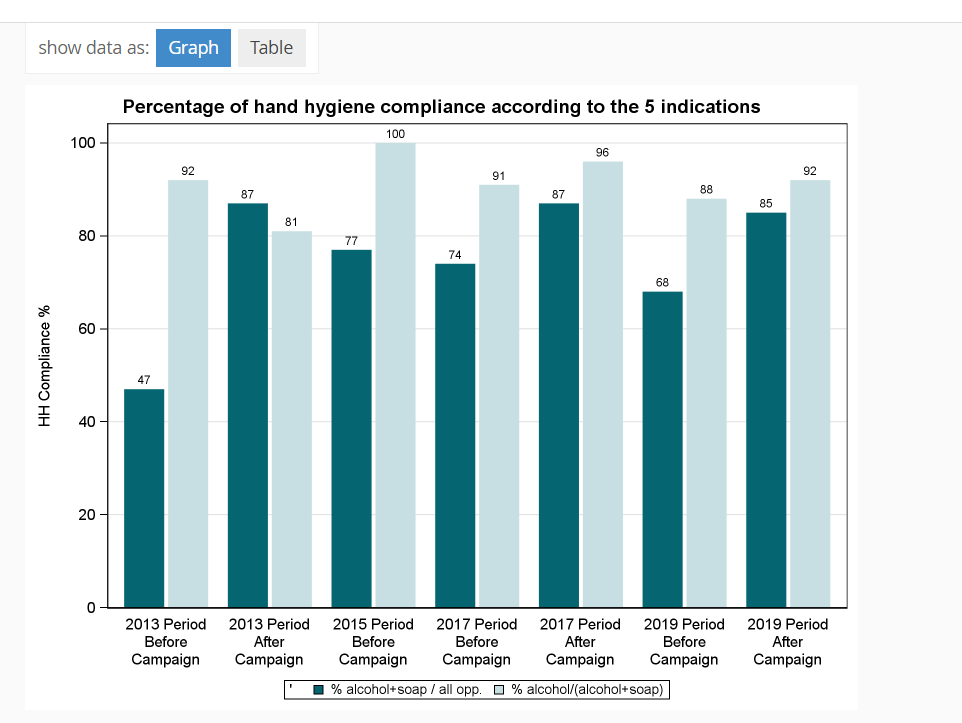
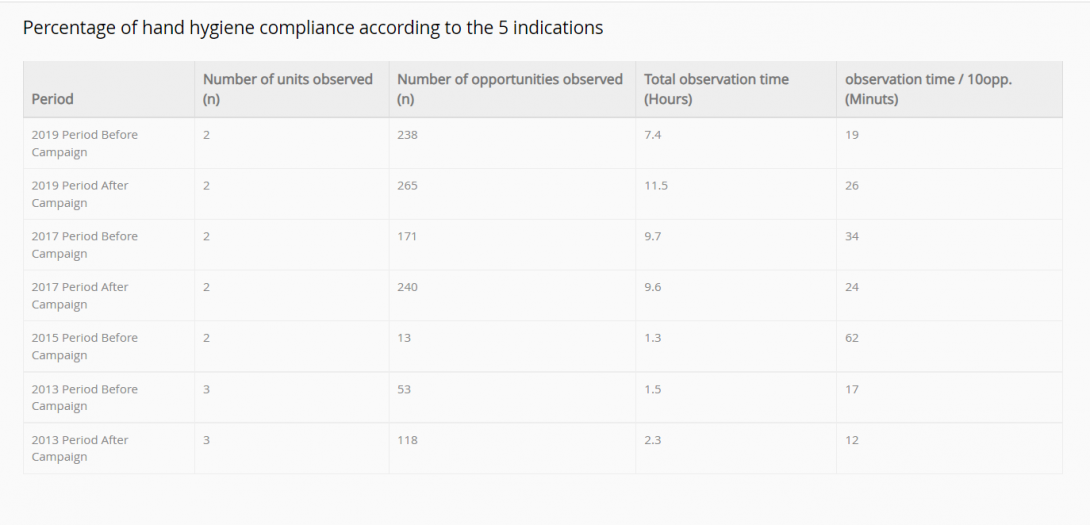
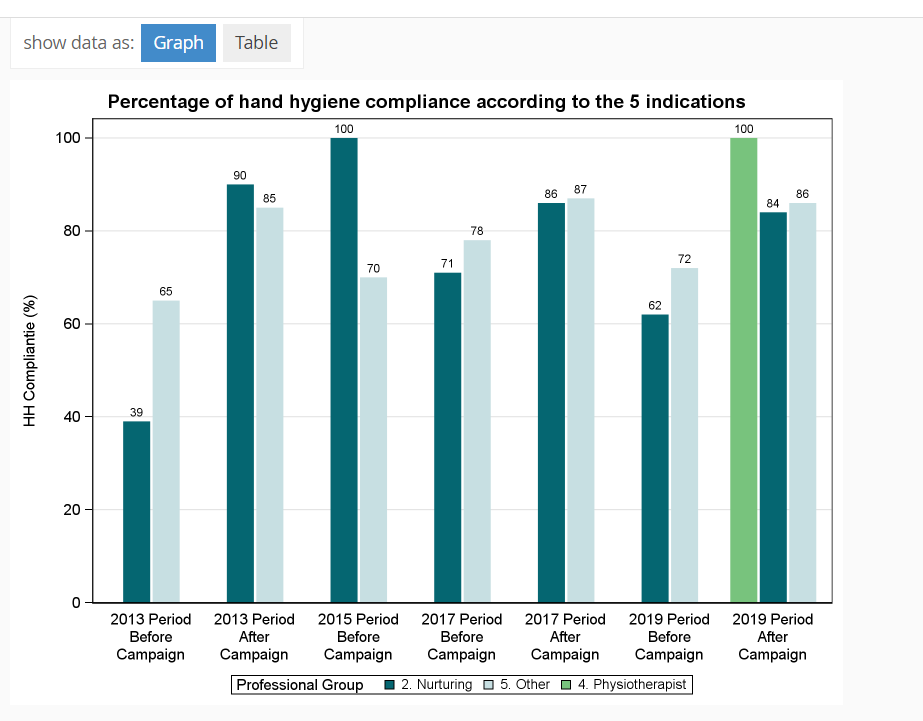
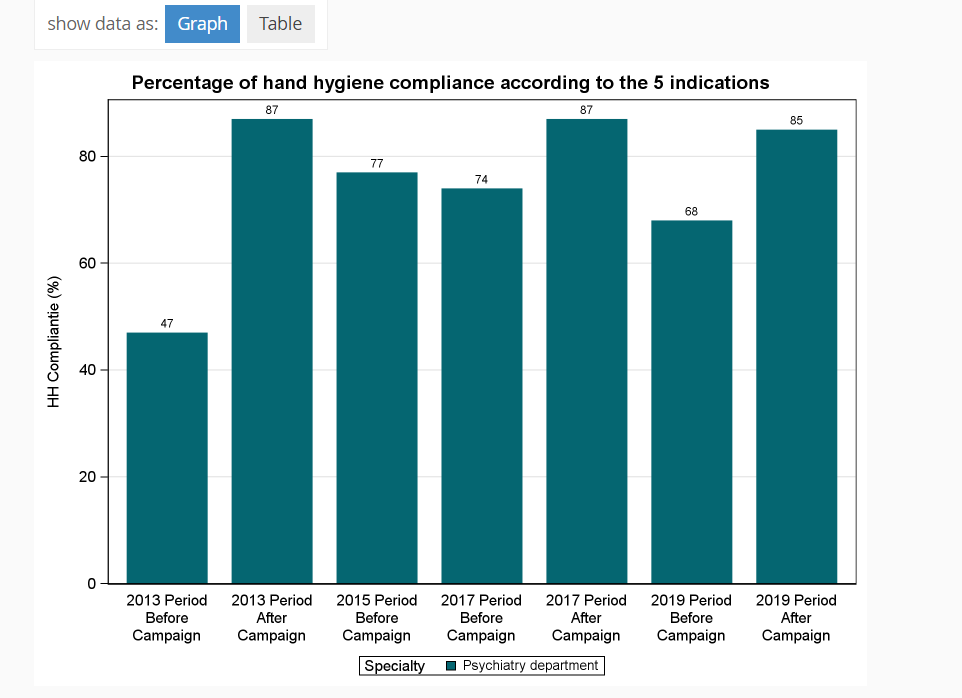
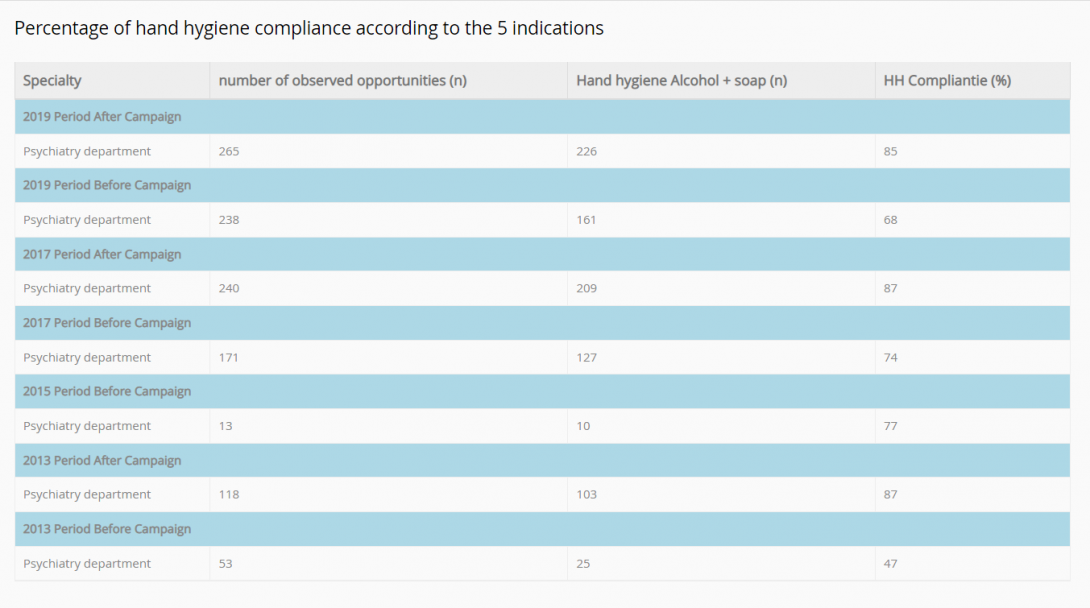
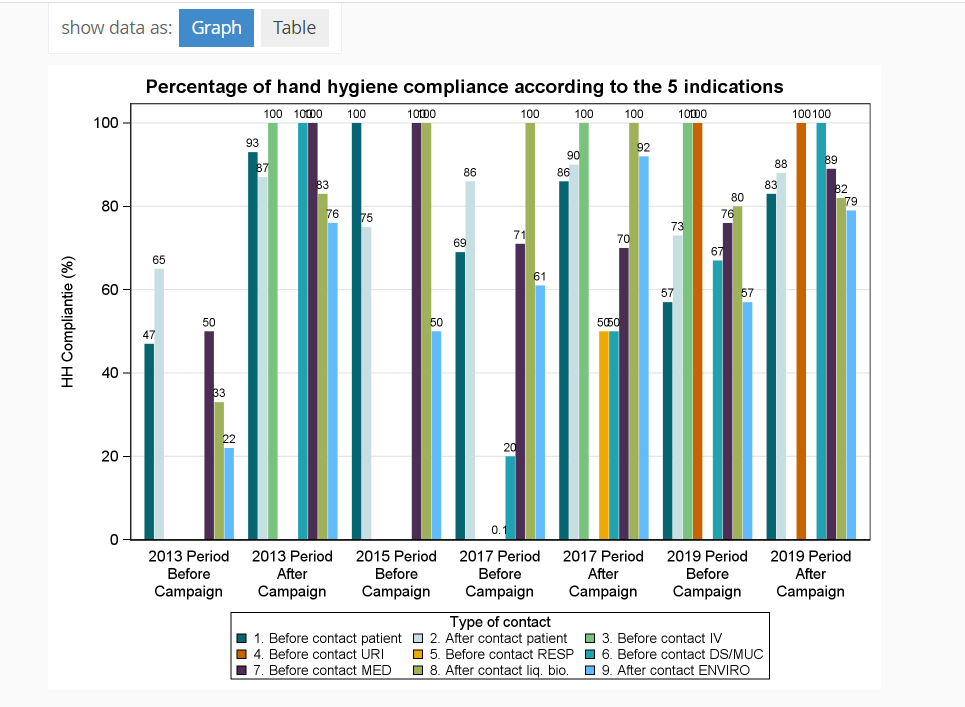
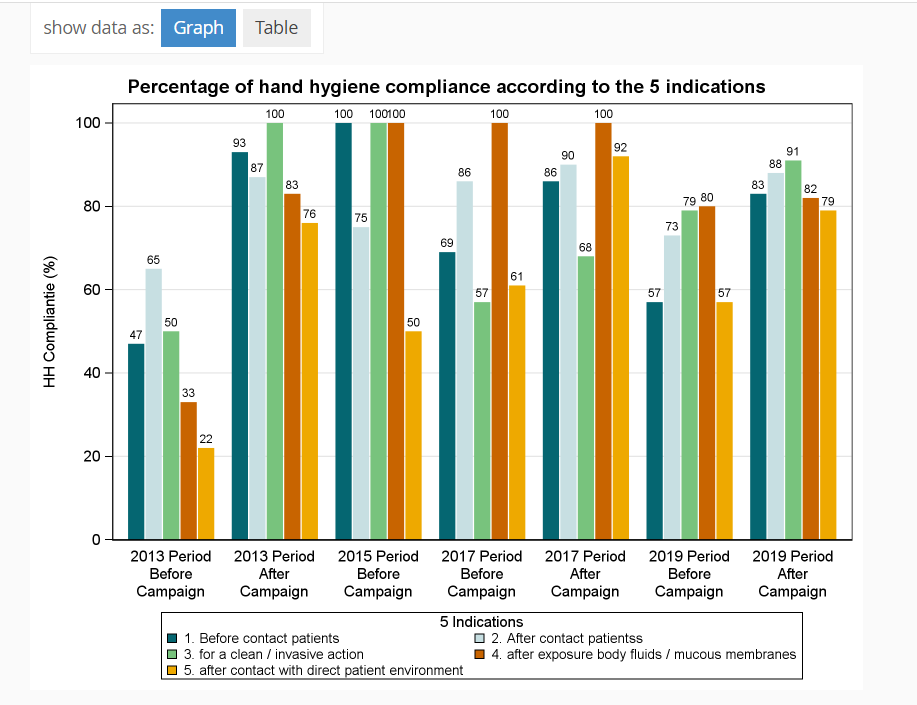
Report 5: Percentage hand hygiene according to the 5 indications
View 1: Summary of selected parameters
View 2: Graph view of report
View 3: Table view of report